Monitoring farms for progress toward sustainability
Monitoring farms for progress toward sustainability
by Karl North and Donn Hewes
Summary: Web graphs, a monitoring tool from Cuba, can track progress toward sustainability of a whole, not just its pieces. They can monitor concerns implicit or expressed in the Holistic Management testing questions, and much more.
“In holistic management, the final step in the partial budgeting process is to consider the balance among ‘net economic benefits, net social benefits, and net ecological benefits.’ Unfortunately, there is no ‘objective’ means of calculating a single expected ‘net total benefit.’ For this, the holistic decision maker will simply have to use his or her common sense.”
– John Ikerd, Sustainable Farm Management
Sustainability has become a slippery word. In an economy that rarely rewards sustainability, powerful interests, threatened by its ecological meaning, have tried to misrepresent it as sometimes subservient to market demands. Consider the above statement. Its author, having rebelled against the mainstream of his discipline, is currently the darling of the sustainable agriculture conference circuit. Yet in his first sentence the word “balance” still seems to entertain the illusion that a policy of compromising ecosystem imperatives to meet market demands is sustainable. Were he a more convinced holist, recognizing that the ecosystem, not the economy, is the foundation of wealth, he would use different language that illuminates that premise.
Now look at the rest of the quotation. Does it refer to the strong consensus in the modern scientific community that there is no objective means of calculating anything? Perhaps, but I think it also exposes a further problem: many scientists, even “liberated” ones like Ikerd, have little experience or training in calculating the progress of wholes toward holistic goals. The best tool Ikerd can come up with is “common sense”. Even Holistic Management has yet to offer a tool for bringing together the various indicators of sustainability in a single picture that shows at a glance how and where progress is being made. But such tools exist, and more will be created, but most likely by holists rather than scientists steeped in specialization.
Web graphs for monitoring sustainability
The tool to be described here we learned from Cuba, where necessity created a nation-wide revolution toward low input integrated farming systems, and then the need to monitor the progress of these new types of farms toward sustainability. Cuban scientists knew the potential of creating synergisms in integrated crop/livestock systems that would enhance productivity, pest control, and efficiency in resource use. But they found that since these results are due to “complex mechanisms, it is common in this type of research that one obtains extremely positive results without being able to provide a clear explanation of their causes.” To capture the dynamics of progress toward sustainability in farms redesigned to be integrated agroecosystems, Cubans used a kind of web graph that would visually summarize sustainability patterns at a glance. These graphs are multi-dimensional, containing as many axes as there are sustainability indicators that the farmer thinks are important to measure. Table 1 is a list of sustainability indicators that are important to Cuban agriculture right now. 2
|
|
|||||||||||||||||||||
Figure 1 is the related Web Graph:
Figure 1: Web graph of progress in sustainability on a Cuban Farm
The idea is to capture in a small number of variables an easily read visual measure of overall progress in the system. These variables are usually defined so that an increase outward from the center along an axis indicates progress in that indicator. That way an increase in the area of the web will indicate overall progress.
The graph in figure 1 is based on extensive calculation. But like the testing questions in Holistic Management, it could be a simple, rough set of estimates, easily sketched out for annual stock-taking, and compared to last year’s web. Farmers could even use a simple scale of 1-100 on each axis, an approach that would enable qualitative measures like ‘farmer satisfaction’. The Cuban graph, although derived from absolute numbers and careful calculation, also shows a simple common scale for all indicators. The absolute numbers are no longer visible because the range of values of each indicator from zero to the optimal has been weighted to fit a common scale of 0-100. That is what the numbers going up the vertical axis mean. This makes the web graph more reader-friendly. In any case, the function of a web graph, like the function of the testing questions in Holistic Management, is not to provide exact answers but to provoke productive reflection. The web graph tool does this by revealing rough trends and relationships.
This tool forces a number of management issues out into the open. First, it shows whole system progress/regress over time. Much of the time graph monitoring conventional science has taught us is mono-dimensional. How whole systems change over time is crucial to understanding how systems work. The web graph forces one to see and think about the changing relationship of all the indicators, and is a reminder that all these variables are interdependent.
Second, it raises the question: what are we measuring and why are we measuring it with the units we have chosen? Check out the units in Table 1. Notice that milk production, for example, is measured in quantity per hectare, not quantity per cow. Implicit in these two measures are two very different farming goals. And what if we measured milk solids/acre? What would that imply?
The indicators the Cubans have chosen to measure reflect a particular approach to input self-sufficiency. Notice that fertilizer is a farm product being measured. This is a clue to why animal food production (in this case milk) is measured separately from other food production. The ruminant animal is the core of their notion of a sustainable system because it can provide both food and fertilizer ingredients from biomass grown without tillage energy, and therefore without disturbing the cover that protects the soil. The idea that the grass/ruminant complex is the core that drives the rest of the farm has generated an important research question in Cuba regarding this system: what proportion of livestock area (forage) to crop area is most sustainable?
Third, energy efficiency, which is not even on the radar of most of our agricultural research community (ours is the least efficient agriculture in the world in this respect), is a carefully calculated output/input ratio in Cuba. They divide the total energy value of plant and livestock production, including biomass for composting into fertilizer by the sum of the energy inputs of tractor, animal traction, and human labor. You may wonder: why track only energy in farm production, when arguably one should track protein and mineral output in the food and feed products as well? In fact the data for this web graph is taken from more detailed tables that do track other variables. But the goal in designing a web graph is to find a small number of indicators that best capture progress toward sustainability, a complex and not easily quantifiable concept. The energy crisis looming over the planet and already felt in many countries like Cuba makes farm energy efficiency an essential goal to be monitored, in Cuban thinking.
Fourth, there is no indicator of monetary profit. In capitalist economics the economic system is the final arbiter of success and is considered permanent, as if it were sanctioned by natural law. But that is like the tail wagging the dog, for as we said at the outset, sustainability in its most meaningful sense recognizes ecological imperatives that trump everything else. When we recognize that we must preserve the natural capital that provides ecological services essential to the survival of civilization, it becomes clear that to be sustainable, human society must shape its economy so that ecologically sound human enterprises are profitable, and are predominant. In Cuba public policy and sheer necessity are combining to shape the economic system so that agricultural sustainability is profitable, so no indicator of monetary profit is necessary in their web graph. In our country neither necessity nor public policy have been significantly brought to bear as yet, so the Cuban agricultural situation is a bellwether of things to come, and its response a model for us to seriously consider.
A web graph of a New York, U.S.A. farm
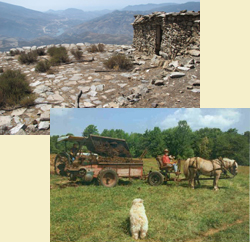
Northland Sheep Dairy is a small grass-based dairy currently supporting a flock of fifty dairy ewes, their lambs, and four draft horses on relatively poor upland soils in New York hill country. Its commercial products are cheese, meat, sheepskins, yarn and knitwear, and occasionally apple cider.
We asked ourselves: what would a web graph of our farm look like? Would we use the same indicators as in Figure 1? Would we define them with the same units as in Table 1?
We played around with these questions using data from our farm. We considered the quick and dirty approach of simply estimating progress on each axis on a scale of 0-100. In the end we opted to quantify progress as best we could, then translate the numbers to the 0-100 scale. Figure 2 shows the graph skeleton consisting of the indicator-axes we have chosen. The circle cuts each axis at the point designated as the ideal or long-range goal for that indicator, so 100% on the scale represents total satisfaction. We estimated upper benchmarks of sustainability somewhat arbitrarily for each indicator.
Figure 2: Sustainability indicator axes for Northland Sheep Dairy
Choosing what you will measure and how you will measure it is the key to successfully graphing a farm’s sustainability. There are an almost limitless number of things you could use to measure sustainability. We began by listing more than twenty. These included references to soil organic matter production, soil fertility, plant diversity, cheese and lamb production, solar dollars, financial profit, animal diversity, and reforestation. We could even use the amount of time spent playing badminton or guitar as one indicator of our progress toward sustainability.
To make a representative graph we tried mixing and matching several indicators at a time to see how they relate to each other, how they reflect other measures that could be left out, and most important, how they demonstrate what we feel are the most important aspects of sustainability for our operation. This process itself, and the discussion it generated, stimulated new thinking about our concept of sustainability. Finally we aimed for a snapshot of progress toward sustainability that reflects the values in our holistic goal. By a process of trial and error we gradually discovered indicators that custom-fit our farm and goal at this time.
1. Farm productivity. We started with a basic measure of productivity. Farm income is often used to represent productivity. But we wanted to avoid income as an indicator because we realize that our farm income comes from an economy that does not reward sustainability, and therefore puts market values on our products that may be different from use values. Since cheese is our most important product, we settled on pounds of cheese/acre as a convenient indicator that could capture productivity with the least calculation.
Our farm plan compensates for operating in this economy with off-farm income, low inputs, efforts at labor efficiency, and value added products. Our genetic goals for our livestock are hardiness, self-sufficiency, and the ability to provide high quality foods and fibers, as much or more than productivity. Looking at our goals we realized that productivity alone does not express much in the way of sustainability for our farm.
2. Sheep health. Next we considered animal health because if it can be maintained or improved while reducing medical intervention, excessive labor, and expensive inputs such as grain or wormers, we would achieve some measure of sustainability. Animal health also directly reflects our efforts to build soil fertility and forage diversity because our livestock are almost totally dependent on the forage our soil produces for feed and nutrition. We chose the percent of the base flock of ewes and rams without health problems in a given year as a measure of sheep health.
3. Lamb growth. Since in our sheep dairy we wean lambs to pasture at 3-4 weeks, we have managed to grow only a portion of the lamb crop to market weight in a single season. The rest are sold as feeder lambs, at considerable economic sacrifice. Lamb growth is important to overall farm productivity. In addition, we thought lamb growth, measured by percent of lambs reaching market weight in one season, would aggregate a number of other sustainability concerns, including control of farm internal parasite populations, ewe fertility and mothering ability, pasture health and forage nutritional quality.
4. Input self-sufficiency. We express this with an indicator that shows progress in reducing the major purchased inputs: hay, custom hay work, medical expenses, seed, livestock feed supplements, maintenance, and fertilizer. Despite our concerns with the use of market values, we decided for convenience sake to gauge input self-sufficiency by net income achieved as a percentage of gross income. In so doing we are also tracking an important determinant of profitability.
5. Fertilizer production. We agree with the Cuban view that to make farming sustainable we must maximize on-farm fertilizer production. We decided to indicate this separately from overall input self-sufficiency because of its importance. Our unit of measure is spreader loads of compost per acre, as a percentage of the fertilization rate we estimate we need to maintain our soil at its maximum fertility potential.
6. Energy self-sufficiency. Here again we created a separate indicator because energy drives all activity and is of paramount importance. While we admire the Cuban measure of energy efficiency — a ratio of calories produced to calories consumed in farm production — we chose an indicator that sacrifices accuracy for simplicity: hours of animal traction used as a percentage of dollars of energy purchased. For now we are rather arbitrarily setting the ideal benchmark at 100%. Despite the lack of dimensional equivalence we think it will adequately track our efforts toward energy self-sufficiency in the near future. Later we will develop a more accurate measure that will include other alternatives to purchased energy, like wind or solar electric, gravity water systems, and new horse-drawn machines.
7. Labor efficiency. It is becoming widely understood that sustainable management of biological systems will require more labor than current attempts to manage them with methods borrowed from industry. But we can mitigate and perhaps even overcome these losses in labor efficiency by finding sustainable ways to put nature to work. The quality of life in any civilization is partially dependent on a degree of labor efficiency in agriculture, which is the basis for all civilizations. We can monitor this fairly easily by tracking changes in the hours worked/day/acre. Since we are fitting all calculations to a scale of 0-100% satisfaction, we need to estimate an ideal labor efficiency. Let us say that ideally 2 people should be able to run our 100 acre farm working 6 hours a day each (the French 35 hour work week approximates this). This gives us an upper benchmark to aim for of 0.12 hours/day/acre. Since these two people cannot work more than 48 hours/day, we can set the lower benchmark at 0.48.
8. Worker satisfaction. The survival of agriculture requires an adequate quality of life for the farmers. Worker satisfaction is perhaps impossible to quantify. We measure it by estimating how well our farming activities satisfy quality of life values in our holistic goal, and representing that on the web graph as a percent of 100% satisfaction.
These indicators, albeit crude in their units of measurement, should nevertheless serve the function intended: to show rough trends in the variables and even patterns of interdependency that stimulate better management. Table 2 shows the units of measure of each indicator, the upper and lower limits in the units shown, how the raw data relates to the 0-100% scale, and the percent of the ideal achieved in the years 1992, 1997, and 2002.
|
|
|||||||||||||||||||||||||||
Table 1. Units of Sustainability Indicators on a Cuban Farm
|
|
|
Indicator |
Units |
|
1. Milk production |
tons/hectare |
|
2. Food production |
tons/hectare |
|
3. Reforestation |
trees/hectare |
|
4. Wildlife diversity |
total species |
|
5. Edible products |
number |
|
6. Fertilizer production |
tons/hectare |
|
7. Labor Intensity |
hours/day/hectare |
|
8. Energy efficiency |
calories produced/calories invested |
The web graph in Figure 3 shows progress/regress on our farm in these measures of sustainability from 1992 To 2002:
Figure 3: Web graph of progress in sustainability on Northland Sheep Dairy
Sustainability at Northland Sheep Dairy
Our web graph fails to show the steady outward progress toward sustainability visible in the Cuban example. Some of our indicators, like sheep health and lamb growth, are sensitive to annual changes in weather and other factors. Perhaps they could more reliably track general trends if they were calculated as averages over several years. However, the regression in lamb growth over ten years does accurately reflect a gradual increase in sheep parasite populations on the farm, from zero parasites when we began raising sheep in 1985. This stemmed from a tactical decision that kept us in business in the first two decades of farm development. It involved a trade-off where we elected to maximize dairy production, our main income source, knowing that this put our sheep stocking rate on the farm too high to fully implement our desired plan of parasite control.
But there are more general reasons for the fluctuations in the graph. A main one is the number of unknowns peculiar to the history of Northland Sheep Dairy. This was not an operation with a long contiguous track record over generations on the same land. Previous farmers had abandoned the land for decades, after many more decades of extractive agricultural practices. We knew its agricultural history only in vague outline. We were practically beginning farmers. There were no models of milking sheep for us to follow in this country. We often undertook other practices that were risky because they had been rarely tried in the region, or because they might sacrifice short run progress to build a system that we hoped would prove sustainable in the long run. Even so, the graph shows some progress on many indicators from 1992 to 1997.
Subsequent regression in certain indicators is due to our decision to include on the web graph the year 2002, when we began to rent land that almost doubles our acreage of intensively manageable acreage. The point of this inclusion is to show how differently indicators behave when they are measured on a per acre basis. The increase in the land base throws farm productivity and fertilizer production, both measured per acre, into regression, at least temporarily. Measuring these variables another way might still show progress, for in absolute terms we are still increasing both. By measuring them per acre we remind ourselves of the challenge of achieving both the sustainable production potential on the new acreage, and a restoration of its ecological capital, which we had already partially attained on the original property.
On the other hand, labor efficiency, also measured on a per acre basis, increases in 2002 almost to the ideal, because we worked twice as much land with only a little more labor than before. The challenge revealed here is to maintain this currently somewhat artificial labor efficiency as we build production to its full potential on the new land.
Can we design management practices that save labor or add labor-saving devices without losing ground in other indicators like input self-sufficiency? This indicator lost ground in 2002 as we began to invest in the new acreage in ways that will yield results only in the long term. The transition to new managers that is happening concurrently also provoked a rise in purchased inputs.
Our chosen indicator of energy self-sufficiency, hours of animal traction as a percentage of purchased energy inputs, shows steady regress over the time period of the web graph. By measuring only animal traction among farm-generated energy products, we give a deceptively low value to this indicator, although by original design the farm was remarkably energy efficient in comparison to most farms. Nevertheless this indicator accurately portrays a failure to compensate for rising energy prices with increases in farm energy production.
Finally, worker satisfaction, though improving slightly over the time period, still measures far below the ideal despite high quality of life on the farm. This is due to the holistic nature of the indicator, pegged as it is to satisfaction of values described in our holistic goal. Our goal values not just what happens in the minimum whole that we can best control, but the state of the nation and other larger wholes as well, reflecting our understanding of the ultimate interdependence of all these. In our estimation the state of the nation and the world declined markedly over the ten year time period, offsetting high and increasing quality of life on the farm.
Just as active use of a goal statement in decision-making leads to its own refinement in an unending, iterative process, we believe we will learn from this web graph tool as we continue to adjust it to meet our needs. We can anticipate learning from this process in several ways. In time we may find indicators that better assess sustainability on our farm. We may find units that more accurately or easily measure an indicator. New knowledge of our agroecosystem, new management tools, and new technologies are all likely to alter our sustainability goals (100% on the graph) as they apply to this landscape. Both the landscape itself and the world around us may change (as in global warming) in ways that require adaptations in this tool.
Conclusions
Graphic display of changes in important sustainability indicators on a single page reveals not only progress/regress in the whole, but also some of the dynamics of interdependence in the variables. In this way it helps us to make decisions that benefit the whole, rather than some parts to the detriment of others. Accurately quantified web graphs are a way for scientists who take a systems approach to evaluate on-farm research experiments over time. Used in a simplified, rough-and-ready fashion, they can help farmers think more holistically in their management, as we have tried to show in a first attempt of a web graph of progress toward sustainability at Northland Sheep Dairy.
Karl North and Donn Hewes
© 2003
1. Sustainable Agriculture and Resistance: Transforming Food Production in Cuba, Fernando Funes et al., eds., Food First Books, 2002.
2. Ibid.
3. Ibid.
4. Labor Intensity in the Cuban web graph appears not to follow the general rule of definitions that portray progress as movement outward from the center of the web. This may be deliberate, for in Cuba and much of the Third World, labor-intensive production is often more sustainable than production that is capital-intensive. In our First world context, labor efficiency appears more sustainable, which may prove to be true only to a point.
5. A goal statement used in Holistic Management that consists of three connected parts: the guiding values that define the quality of life you desire, the activities or forms of production that will express or achieve that quality of life, and how the resource base (community, environment, financial assets) must be managed to sustain the desired activities far into the future. Article.
6. In 2002 we began renting land that almost doubles our intensively manageable acreage.
One of the founders of Northland Sheep Dairy in Marathon, New York, U.S.A., Karl North is in the Holistic Management Certified Educator Training Program. Contact him at northsheep@juno.com. Donn Hewes is half the new management team taking over the farm. Contact him at tripletree@flare.net.
Related articles and links
Landscape monitoring for ecosystem health. Monitoring method comparisons, Land EKG, Pasture Walk, and more. At managingwholes.com.
Holistic Management testing questions. Learn the basics. At managingwholes.com.
Setting good goals briefly describes Holistic Management goal-setting. At managingwholes.com.